Queensland · Postcode 4350

Cranley, QLD 4350: property investment analysis

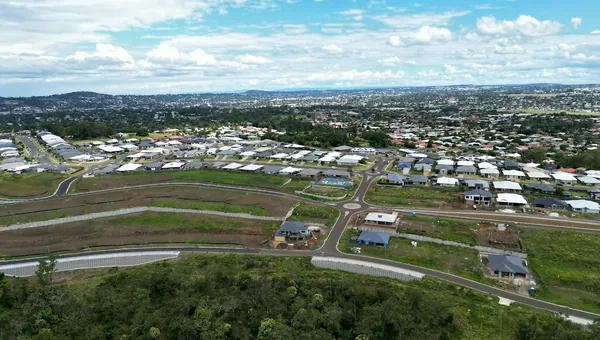
Cranley is a small suburb on Toowoomba's north-western edge, sharing postcode 4350 with the wider Toowoomba urban area. The postcode reads SEIFA decile 4, 46th state percentile in Queensland, at an IRSAD score of 953.

Cranley, QLD 4350 property investment analysis
4 / 10
SEIFA decile (IRSAD)
National relative advantage
46th
State percentile
vs all Queensland postcodes
953
IRSAD score
National mean = 1000
Mid-band
Relative band
ABS 2021 Census release
SEIFA position
Where Cranley sits nationally
Decile 4
1 disadvantaged 5 median 10 advantaged

ABS 2021 IRSAD release. Score 953 (national mean = 1000).

Reading the signal

What the SEIFA reading means for Cranley

Because Cranley shares 4350 with the broader Toowoomba postcode, the SEIFA reading describes the city, not the suburb. The decile 4 figure is a blended average across central Toowoomba, the eastern range suburbs, the western corridor, and Cranley itself. For investors looking at Cranley specifically, the interesting question is whether the suburb sits closer to the postcode average or whether it skews lower because of its position on the western fringe. PropertyRanker uses SEIFA as a primary signal for economic_strength, hazard_risk, and entry_point_risk. A decile 4 reading places Cranley below the national mean on those three criteria when looked at via the postcode, but the entry_point_risk reading is partially offset by lower headline pricing for the suburb compared with central Toowoomba. The strategy mix that tends to work in 4350 is Balanced or Yield. Cranley's specific stock profile, smaller in scale than the rest of the postcode and more affordable per square metre, can lift the gross yield closer to the 6% anchor used in the Yield strategy. That is the structural reason the suburb shows up in growth-corridor screening, not a SEIFA-driven reason.

Recent market signal

What the data is doing right now in Cranley

Cranley QLD 4350 recorded a median house sale price of $668,000 with 6.1% annual growth and a vendor discount of -7.1% per propertyvalue.com.au (Cotality data), while yourinvestmentpropertymag.com.au (CoreLogic, to September 2025) reported a higher median of $745,000 with 15.06% annual growth, reflecting differing calculation windows and methodologies. There were 18 house sales in the 12 months to September 2025 per CoreLogic, and 30 sales per Cotality, with average days on market of 18 to 19 days across both sources. The Queensland rental market broadly tightened through early 2025 per REIQ, and Cranley's short days on market and vendor discounting profile suggest a steady to warming market.

Median price trend
3-point price path for Cranley
2024 2025 2025 $629k $745k

Anchor points pulled per refresh from publicly available suburb profiles. Approximate; not a moving average.

Market temperature
Buyer pressure right now in Cranley
Steady
Cold Cool Steady Warming Hot
Vacancy
tightening
Days on market
stable
Vendor discount
stable

Queensland vacancy rates tightened through early 2025 per REIQ, days on market are short at 18-19 days with no clear directional change published, and vendor discounting at -7.1% is present but no trend direction was found, yielding an overall steady band.

Sources: Cranley House Prices & Property Trends (2025-01-01); Cranley, QLD 4350: Suburb Profile & Property Report | YIP (2026-01-06); Queensland's rental market: A New Year, even fewer options (2025-03-01); Cranley, QLD 4350 Property Market and House Prices 2025 (2022-06-25) · Refreshed 14 Sep 2026

How PropertyRanker scores

How a listing in Cranley would be scored

PropertyRanker scores any Australian property against 12 criteria across three pillars: Growth, Cashflow, and Risk. SEIFA is a primary signal for economic strength and a supporting one for entry-price risk. It also informs the crime side of hazard risk, though physical overlays like flood, bushfire and coastal exposure, and recorded crime data where available, take priority there. The decile of 4 shown above gives a listing in Cranley a broadly mid-band starting line on economic strength and entry-price risk relative to the national median postcode.

On top of that, PropertyRanker chooses one of four strategies (Balanced, Growth, Yield, Regional) and applies a per-strategy yield anchor. The anchors are 3.5% for Growth, 5% for Balanced, 6% for Yield, and 7% for Regional. A mid-band postcode does not favour one strategy outright; Balanced (5% anchor) is the common fit, with Yield (6%) reachable where a specific listing rent-to-price ratio supports it.

Read the scoring guide for the full criteria list and how the verdict thresholds work.

Comparable postcodes

Nearby suburbs worth comparing

SEIFA is a postcode-level read. The fastest sanity check on any single decile reading is to compare it against the suburbs that surround it.

What this page cannot tell you

What an investor should still verify in Cranley

SEIFA cannot tell you which side of Toowoomba a Cranley listing sits relative to recent infrastructure decisions, including the Bypass and the Inland Rail alignment. It also cannot speak to flood, bushfire, or soil-stability characteristics specific to the western edge of the city. Comparable-sales coverage in a smaller suburb is thinner than in central Toowoomba, so the listing's price guide needs more scrutiny than usual. Score the listing for a verdict that accounts for these specifics.

Questions investors ask

Cranley property investment: common questions

Does Cranley suit property investment, and what does its SEIFA reading say about the suburb?

The SEIFA data places postcode 4350 at decile 4, an IRSAD score of 953 against a national mean of 1000, which puts it below the midpoint on economic strength. The important caveat is that Cranley shares postcode 4350 with the broader Toowoomba urban area, so that figure is a blended average across very different neighbourhoods, not a precise read on Cranley alone. PropertyRanker uses SEIFA as a primary signal for economic_strength, hazard_risk, and entry_point_risk, so any listing here will carry the mid-band SEIFA flag on those three criteria. Whether a specific property offsets that through yield or land characteristics is what scoring a listing will show you.

Which PropertyRanker investment strategy fits Cranley best?

The analysis points toward Balanced (anchored around 5 percent gross yield) or High Yield (anchored around 6 percent) as the strategies most consistent with what Cranley's stock profile tends to produce. Cranley sits on Toowoomba's north-western fringe and its more affordable per-square-metre pricing, relative to central Toowoomba, is the structural reason it appears in yield-oriented screening rather than pure Capital Growth screening, which targets around 3.5 percent. Score the specific listing to see which strategy band the live yield actually lands in, because individual properties within the postcode vary considerably.

What are the main investment risks an investor should verify for a Cranley property?

The first risk to check is flood exposure: Cranley's northern and eastern boundaries follow Gowrie Creek, and Toowoomba has a documented history of flash flooding in creek catchments, with Toowoomba Regional Council maintaining a Flood Hazard Overlay Code that applies stricter development controls in affected zones. Investors should run the council's flood risk information portal for the specific address before drawing any conclusions about hazard_risk scores. The second risk is the blended-SEIFA limitation; because the decile 4 reading covers all of postcode 4350, a property on the western fringe of Cranley may sit in a pocket with lower socioeconomic indicators than the postcode average suggests, which can affect tenant demand and vacancy. Finally, public transport access in Cranley is limited to bus services, with no local rail connection, so tenant cohorts that rely on private vehicles are the more likely occupant profile.

How does PropertyRanker score a listing in Cranley differently from a listing in central Toowoomba?

Both sit inside postcode 4350, so they share the same SEIFA inputs, decile 4 and a raw score of 953, on the economic_strength, hazard_risk, and entry_point_risk criteria. Where Cranley listings can diverge is on yield-related scoring: lower headline pricing in the suburb relative to the Toowoomba CBD can push gross yield closer to the 6 percent anchor used in the High Yield strategy, which in turn shifts the strategy-fit weighting. Hazard scoring may also differ at the listing level once property-specific flood overlay data is applied, since Cranley properties near Gowrie Creek carry different exposure than a ridge-top property in East Toowoomba.

Is the Toowoomba Second Range Crossing relevant to Cranley as an investment factor?

The Toowoomba Second Range Crossing, opened in 2019, established an interchange near the northern entry to central Toowoomba and rerouted Warrego Highway traffic away from the inner city, with commentary at the time noting potential for commercial activity to develop around Cranley to serve bypass traffic. Whether that potential has translated into measurable demand uplift for residential property is something to verify with current data rather than treat as a given. PropertyRanker does not use infrastructure proximity as a direct scoring input, but an investor can use it as context when assessing the suburb's longer-term demand drivers alongside the platform's yield and SEIFA-based scores.
Score a listing in Cranley

Paste a real address. Get a defensible verdict across 12 criteria in around three minutes.

Score a property free