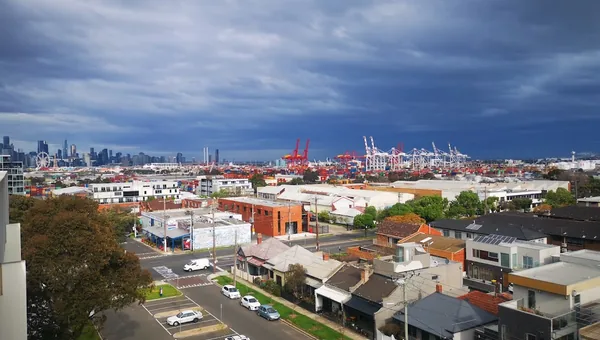
Footscray sits 5 km west of the Melbourne CBD, on the Maribyrnong River, in the City of Maribyrnong. It scores a SEIFA IRSAD decile of 8, putting it in the 77th percentile within Victoria for relative advantage. That single signal does a lot of work in any honest scoring of the suburb.
ABS 2021 IRSAD release. Score 1048 (national mean = 1000).
An IRSAD decile of 8 is a strong reading for a suburb that, ten years ago, was still being scored as mid-band. The 1048 raw score is comfortably above the national mean of 1000, and the 77th state percentile suggests Footscray has decoupled from the broader Western Melbourne profile. For a property scoring engine that uses SEIFA as a primary signal for economic_strength and entry_point_risk, that decoupling matters. It means the affordability narrative people still tell about Footscray (cheap inner-Melbourne suburb, gentrifying) is no longer fully supported by the data; the suburb is closer to the inner-north average than it is to its 2014 self. Worth holding in mind when reading agent commentary, which tends to lag the dataset. None of this says Footscray is a buy. Decile 8 is one of twelve signals PropertyRanker scores against, and it sits on the macro side of the model. It does not see the strata, the build year, the orientation, or the street. What it does say is that the base economic context for a property in 3011 is, as of the 2021 ABS release, in the top quartile of Victorian postcodes. A specific listing can score well or poorly inside that frame.
Footscray's house market is showing mild price softness, with propertyvalue.com.au (Cotality/CoreLogic data) recording a median house price of $920,000, down 3.7% over the past 12 months, while yourinvestmentpropertymag.com.au (CoreLogic, to June 2026) reports $950,000 with a 3.26% annual gain, reflecting some variation across measurement windows. Sales volumes have risen sharply, with woodards.com.au recording 224 house sales, up 23.8% year-on-year, though vendor discounting sits at -5.0% and days on market have edged up to 40 days, pointing to a market where buyers retain some negotiating power.
Vacancy is stable at 1.36%, but days on market are lengthening (up 5.3% YoY to 40 days) and vendor discounting is elevated at -5.0%, giving two softening signals that place the market in the cool band.
Sources: Footscray House Prices & Property Trends (2026-01-01); Footscray, VIC 3011: Suburb Profile & Property Report | YIP (2026-09-19); Footscray, VIC Property Market & House Prices | Woodards (2026-01-01); Footscray VIC 3011: Median Prices, Trends & Profile | PropertyGo (2026-08-19); Footscray VIC 3011 Property Market and House Prices 2026 | HtAG (2026-01-01) · Refreshed 28 Sep 2026
PropertyRanker scores any Australian property against 12 criteria across three pillars: Growth, Cashflow, and Risk. SEIFA is a primary signal for economic strength and a supporting one for entry-price risk. It also informs the crime side of hazard risk, though physical overlays like flood, bushfire and coastal exposure, and recorded crime data where available, take priority there. The decile of 8 shown above gives a listing in Footscray a stronger starting line on economic strength than the national median postcode, and a softer one on entry-price risk, since more advantaged postcodes usually carry higher entry prices.
On top of that, PropertyRanker chooses one of four strategies (Balanced, Growth, Yield, Regional) and applies a per-strategy yield anchor. The anchors are 3.5% for Growth, 5% for Balanced, 6% for Yield, and 7% for Regional. A postcode at this level of relative advantage tends to suit the Growth (3.5% anchor) and Balanced (5% anchor) strategies more readily than Yield (6%) or Regional (7%), because a higher entry price compresses the gross yield a listing can reach without a specific value-add.
Read the scoring guide for the full criteria list and how the verdict thresholds work.
SEIFA is a postcode-level read. The fastest sanity check on any single decile reading is to compare it against the suburbs that surround it.
SEIFA is a postcode-level read, so it cannot tell you about a specific street, a specific building, or the conditions inside a body corporate. Things that PropertyRanker will pull at score time, but that a static suburb page cannot: current vacancy rate from SQM (Footscray has historically run tight, but the inner-west rental market shifts quarter to quarter), the body corporate health on apartments, the flood and overlay status on the Maribyrnong-side properties post-October 2022, and the actual listing's pricing against recent comparable sales. The 2022 floods materially changed how the river-flat sections of 3011 are insured and priced, and a SEIFA decile does not reflect that. Score the specific listing before you draw a conclusion.
It depends on the specific listing and your strategy, but the macro backdrop is solid. Footscray carries a SEIFA IRSAD decile of 8, an advantaged reading that sits at the 77th percentile in Victoria and feeds three of PropertyRanker's twelve criteria. Recent market data tempers that: CoreLogic figures published in early 2026 put the median house price around 920,000 dollars for the 12 months to March 2026, an annual decline of roughly 3.7 percent across 182 house sales. A strong socioeconomic profile and a tight rental market do not, on their own, make any individual property a good buy, so the answer comes down to how a specific listing prices against recent comparable sales.
PropertyRanker does not publish a fixed suburb yield, because gross yield swings with the individual property and the price paid. What the data does show is a tight rental market: vacancy has been running near 1.26 percent, which is low and supports rental demand. That said, an advantaged inner-Melbourne suburb with a house median near 920,000 dollars will usually deliver a gross yield below the 6 percent anchor PropertyRanker uses for its Yield strategy, which is why houses here tend to score better on the Growth and Balanced strategies than on Yield. Score the actual listing to see the real figure.
For most Footscray houses, the Growth (3.5 percent yield anchor) and Balanced (5 percent anchor) strategies are the more natural fit. Inner-Melbourne entry prices compress the gross yield a listing can reach, so clearing the 6 percent Yield anchor or the 7 percent Regional anchor is difficult without a specific value-add such as a subdivision or a strong renovation angle. Apartments can shift that maths, since a lower entry price can lift yield, but they carry body corporate and oversupply considerations of their own.
Three worth checking. First, price momentum: the most recent 12-month median moved down around 3.7 percent, so recent capital growth has not been one-directional. Second, flood exposure: Footscray sits on the Maribyrnong River, and parts of the catchment have a documented flood history, so an overlay and lot-level flood check is essential rather than optional. Third, for apartments, body corporate health and the depth of unit supply, since both are invisible to a suburb-level reading. None of these rules Footscray out; they are the specific things a postcode score cannot see and a buyer should verify.
At score time PropertyRanker pulls the SEIFA decile shown on this page, current SQM vacancy and rent figures for postcode 3011, ABS 2021 census demographics, a PropTrack automated valuation where available, recent comparable sales, and crime statistics, then runs the address against all twelve criteria for your chosen strategy. This page is a static suburb-level snapshot; the live score reflects the specific address, its price, and current market data.
Paste a real address. Get a defensible verdict across 12 criteria in around three minutes.
Score a property free